08/31/2021
Transformations of Functions
We'll continue our discussion of graph of functions. The type of elementary transformations of functions is listed below:
- \(f(x)\leadsto cf(x)\) for some real number \(c\);
- \(f(x)\leadsto f(x)+c\) for some real number \(c\);
- \(f(x)\leadsto f(cx)\);
- \(f(x)\leadsto f(x+c)\).
To analyse the graph of this function, we start with the "standard model" \(y=\sin x\): the graph of this function has been drawn last week and we know that the graph looks like.
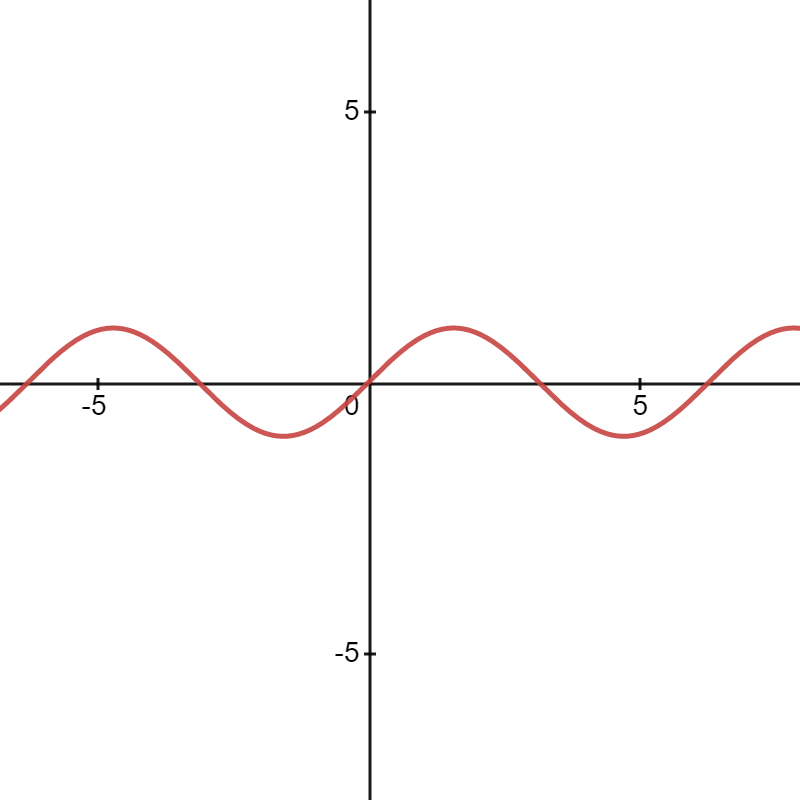
This is the graph of function \(y=\sin (x)\), and in order to draw the graph of function \(y=\sin\left(\frac{x}{2}\right)\), notice that for the value of \(\frac{x}{2}\) to be \(a\), \(x\) must be \(2a\), so the graph would be a horizontal stretch of \(y=\sin (x)\), so the graph of \(y=\sin\left(\frac{x}{2}\right)\) looks like
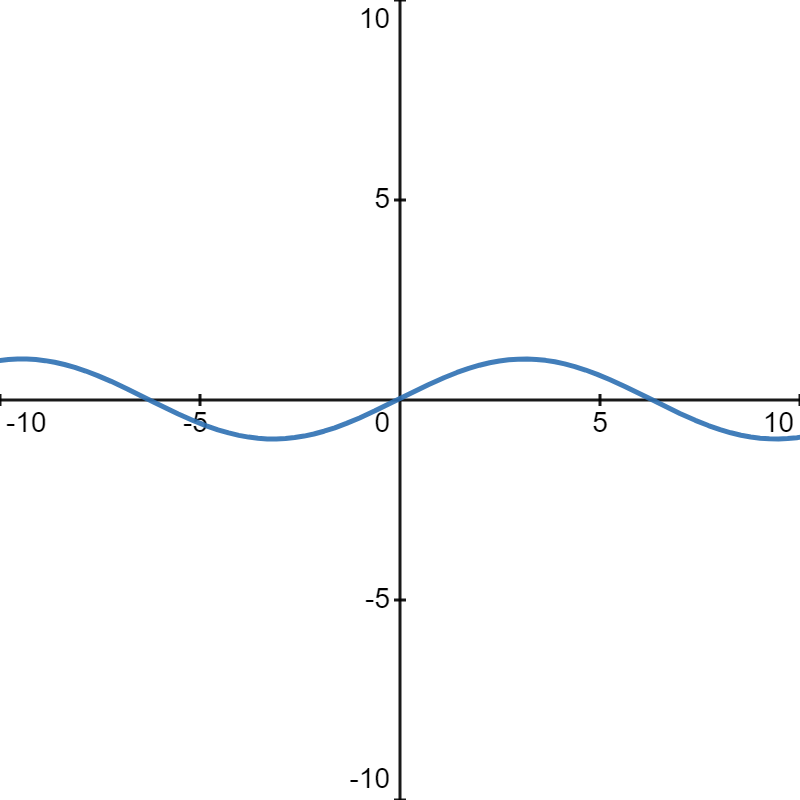
Putting these two graphs into one canvas, we get
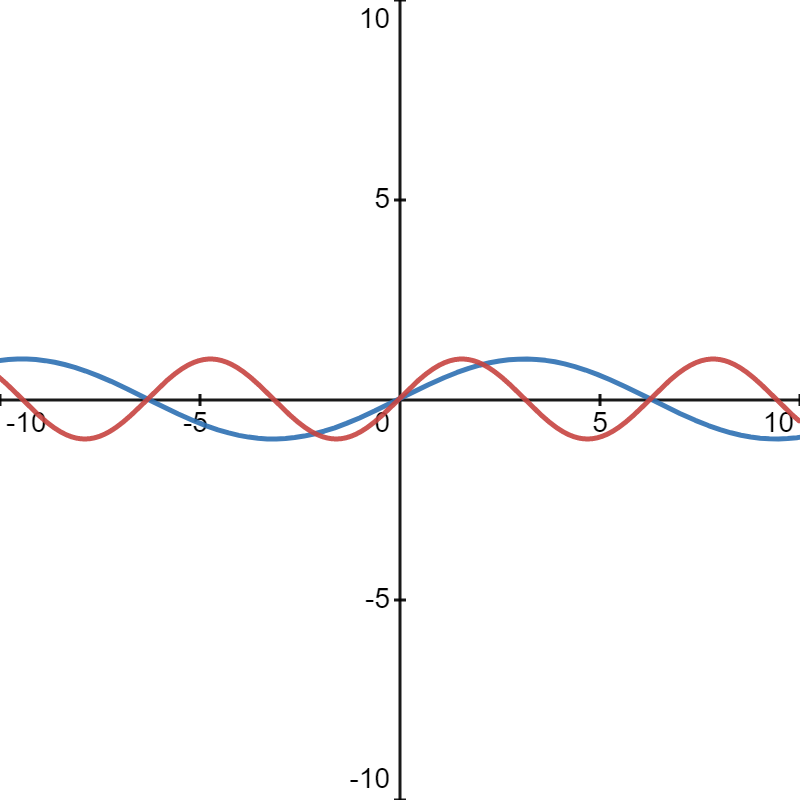
which gives you an intuition of what is meant by "horizontal stretch".
Now let's see another example.
\(y=\vert x\vert -2\).This is a relatively easy one. We start with the "standard model" \(y=\vert x\vert\). The graph of this function is
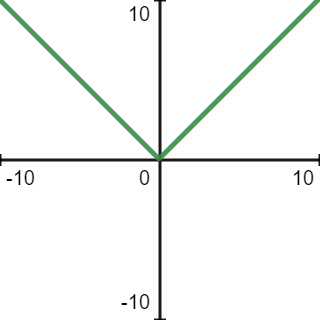
subtracting from this function by \(2\) means moving the graph downwards by \(2\) units. So the graph of the transformed function is
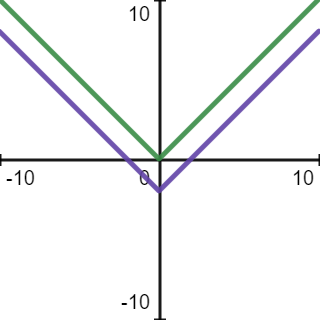
The purple line is the graph of the function \(y=\vert x\vert -2\).
The third example is the tangent function \(y=\tan\left(x-\frac{\pi }{4}\right)\). Note that the standard model is \(y=\tan (x)\), whose picture looks like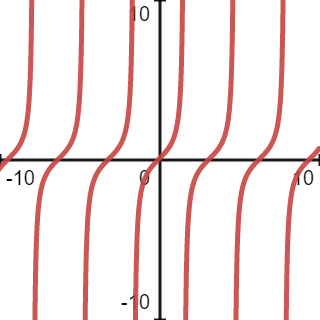
For the function \(y=\tan\left(x-\frac{\pi }{4}\right)\), note that for \(x-\frac{\pi}{4} =a\), we have \(x=a+\frac{\pi}{4}\), so the graph of \(y=\tan\left( x-\frac{\pi}{4}\right)\) would be a translation of the standard model \(y=\tan (x)\) to the right by \(\frac{\pi}{4}\) units. So the graph of the function \(y=\tan\left(x-\frac{\pi }{4}\right)\) would look like
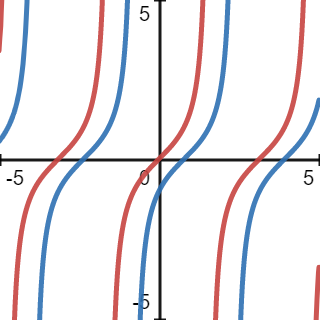
where the blue curve is the graph of the function \(y=\tan\left( x-\frac{\pi}{4}\right)\).
Finally, we consider the more complicated function \(y=\frac{1}{4}\tan\left(x-\frac{\pi}{4}\right)\). This is obtained from the previous example by multiplying by \(\frac{1}{4}\), and so the resulting graph would be a compression of the previous graph. So the graph is shown as follows: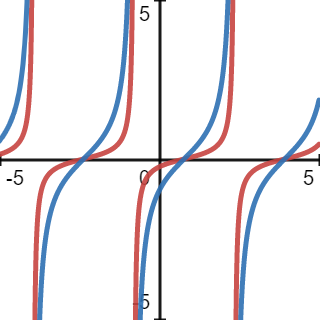
Now we have seen how elementary transformations affect the graph of a function. If we have multiple elementary transformations, we can firstly write them as a composition of several elementary transformations of a "standard model", the essential functions that we have met before, and to sketch the graph of this function using the standard model and the elementary transformations. We can also analyse the domain and the range of the function.
As an exercise, try to analyse the function \(y=2\sin \left(3x+\frac{\pi}{6}\right)\), that is, try to figure out its domain, range and try to sketch a graph of this function.